Heatmaps
To Identify Problems More Quickly
Discover where users are clicking the most on your website by looking at interactive visualisations of user engagement data obtained from user session recordings.
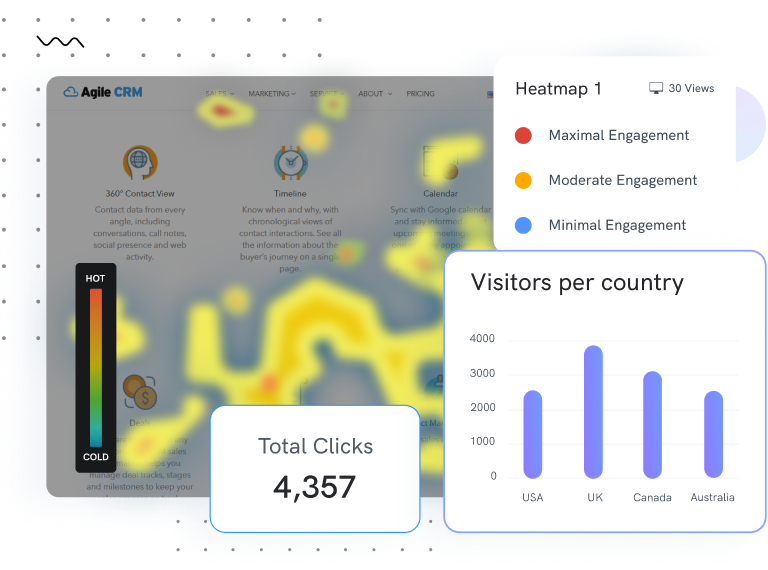
To Identify Problems More Quickly
Discover where users are clicking the most on your website by looking at interactive visualisations of user engagement data obtained from user session recordings.

91,436+
Businesses
6
Data Centers
99.5%
Global Uptime
50
Apps Just $14.99
Top 10 reasons why your business should use SiteRecording and 50+ other apps from 500apps
Distinctive Dashboard Analytics
Unlimited Recordings
User Behavior Analytics
Improved Engagement Rate
Real-time Monitoring System
Customer Behaviour Analytics
User Experience Optimization
Improved Conversions & Revenue
Unbelievable pricing - the lowest you will ever find
Everything your business needs - 50 apps, 24/5 support and 99.95% uptime
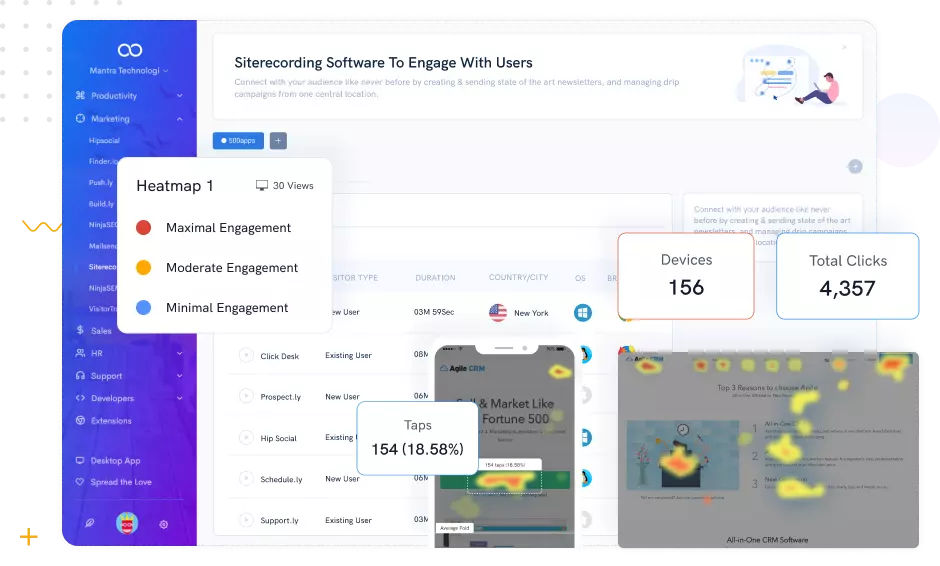
A heatmap is a graphical representation of data where the individual values contained in a matrix are represented as colors. Heatmaps are used to easily identify
Limitless Possibilities. What will you do for your business?
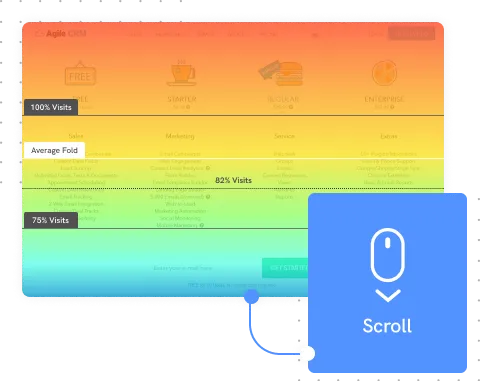
View the percentage of your visitors who scroll down to the section of your website on each page. Also, look at the average fold to see what the majority of visitors see on their screens when they first arrive at the page and before they begin scrolling.
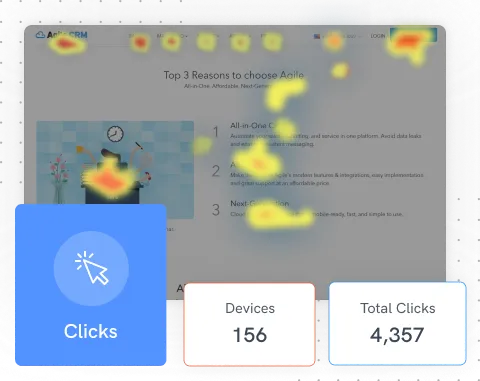
Know where your visitors click on your website, including links, buttons, images, and other calls to action, on both the desktop and mobile versions. Assessing this information will assist you in identifying areas where your website could be improved.
Analyse how the website performs on mobile devices. By understanding where visitors' taps were not responsive, you may improve the placement and size of your calls-to-action on your website.
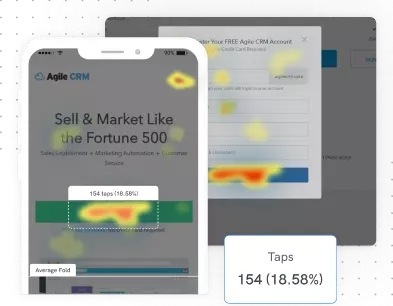
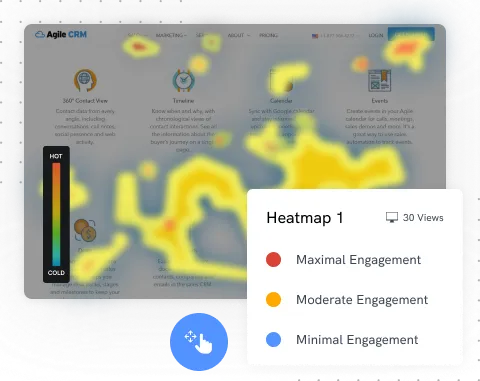
Stay updated on where desktop users move their mouse and where they prefer to linger, as these may indicate regions of greater interest to your visitors. These hot and cold locations are represented by colours ranging from blue to red.
Our application effectively delivers the best-in-class features for your every business needs
